Kesu - Fotolia
How to set up Prometheus for Kubernetes monitoring
Prometheus enables IT teams to automate and quickly configure infrastructure monitoring with open source tools natively in Kubernetes. Follow this tutorial to get started.

Kubernetes helps IT teams manage distributed applications in containers, but it also introduces new challenges -- such as monitoring. To properly monitor the dynamic components in a containerized ecosystem, teams need tools that deploy and scale natively in Kubernetes.
To use Prometheus, administrators need to understand its client libraries, the components in the kube-prometheus project and other technologies, such as Operators in Kubernetes. Then, they can install and run Prometheus for Kubernetes monitoring with the steps presented here, relying on the Helm package manager and kubectl command line.
Prometheus overview
Prometheus is an open source event monitoring and alerting application. Originally developed at SoundCloud, Prometheus was donated to the Cloud Native Computing Foundation (CNCF) in 2016 and is now hosted on GitHub as a standalone independent project. It captures real-time metrics in a time-series database, and provides a multi-dimensional data model and a flexible query language. Prometheus uses the pull method to collect metrics over HTTP, though users can implement push-based monitoring for limited use cases.
IT administrators can use Prometheus for Kubernetes monitoring -- but first, they must add the necessary instrumentation to their code.
To do this, use one of the Prometheus client libraries that implements various types of metrics. Choose the client library that matches the primary application development language. This enables developers to define metrics and expose them on the application instance through HTTP endpoints.
Some of the most commonly used client libraries to write and expose monitoring metrics include Go, Java or Scala, Python and Ruby.
In addition, unofficial third-party client libraries include Bash, C, C++, Elixir, PHP and Rust.
Prometheus integrates with other applications as well, such MySQL, Amazon CloudWatch and Kubernetes, through official and third-party exporters.
The Prometheus Operator and kube-prometheus project
An Operator in Kubernetes is a domain- and app-specific controller that acts as an extension of the Kubernetes API to manage application instances. The Prometheus Operator for Kubernetes provides a way to build, configure and manage Prometheus clusters on Kubernetes.
The kube-prometheus project is for cluster monitoring and is configured to gather metrics from Kubernetes components. It also has capabilities for dashboards and alerting rules. The project is open sourced on GitHub and combines Kubernetes manifest files, preconfigured Grafana dashboards, and Prometheus rules to deliver an abstraction layer and Kubernetes cluster monitoring capabilities via the Prometheus Operator.
The following components are included in the kube-prometheus package, as noted on GitHub:
- The Prometheus Operator
- Prometheus server
- Alertmanager
- Prometheus node-exporter
- Prometheus Adapter for Kubernetes Metrics APIs
- kube-state-metrics
- Grafana dashboards
Installation and configuration
Before installing Prometheus for Kubernetes monitoring, have a Kubernetes cluster up and running and install the Helm package manager, which is useful for getting the Prometheus Operator.
Then, create a separate namespace for the monitoring setup:
kubectl create namespace monitoring
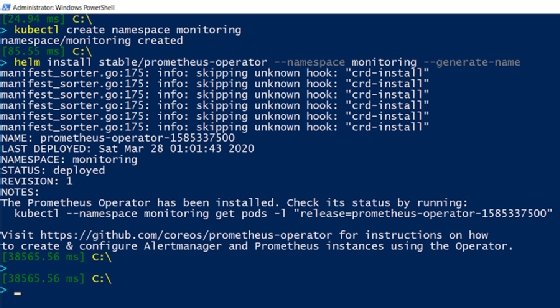
Next, install a stable release of the Prometheus Operator in the monitoring namespace. This release is a close match to the kube-prometheus project discussed in the previous section:
helm install stable/prometheus-operator --namespace monitoring --generate-name
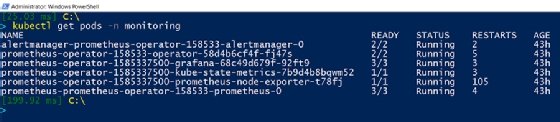
After the Prometheus Operator installs, wait a few minutes for the containers to launch and then for the system to list all the pods running under the monitoring namespaces:
kubectl get pods -n monitoring
Figure 2 shows some pods running various components of the Prometheus Operator, such as a Prometheus dashboard, a Grafana dashboard and the Alertmanager.
Next, use port-forward to view the Prometheus dashboard on port 9090 by opening http://localhost:9090:
kubectl port-forward -n monitoring prometheus-prometheus-operator-158533-prometheus-0 9090
After we launch the browser and open localhost at port 9090, we'll be redirected to the Prometheus expression browser at http://localhost:9090/graph. Here, Prometheus users can write and execute ad hoc queries, debug using expressions and see results either in a tabular view or as a graph plotted over time.
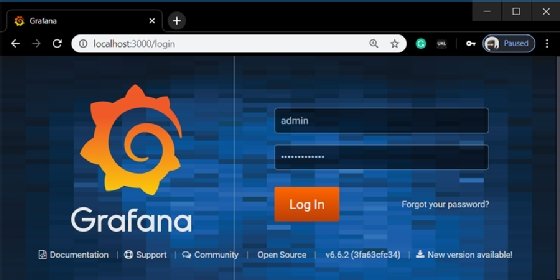
To view the Grafana dashboard, set up port-forwarding to port 3000, and access it from the browser at http://localhost:3000:
kubectl port-forward prometheus-operator-1585337500-grafana-68c49d679f-92ft9 3000 -n monitoring
When prompted to log in at the dashboard shown in Figure 3, enter the username "admin" with password "prom-operator" in the respective input text boxes.
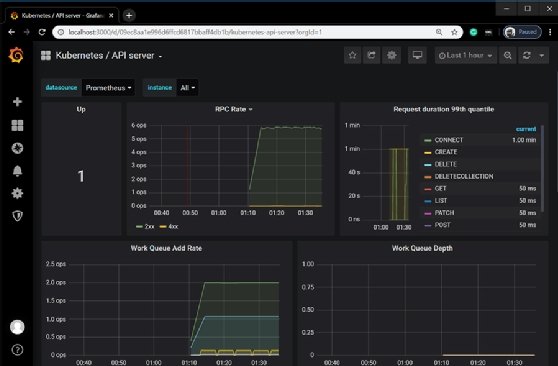
The Grafana dashboard features graphs and plots metrics from time-series databases, with Prometheus as the data source. For example, in Figure 4, the dashboard monitors the Kubernetes API server for requests, memory, CPU usage and running routines.
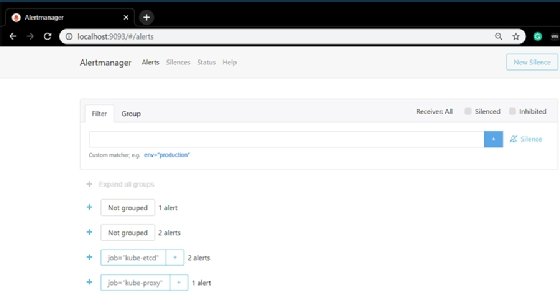
Finally, let's look into the Alertmanager, which handles alerts sent by the Prometheus server. This component properly groups alerts, deduplicates them to reduce unnecessary noise and sends them to appropriate teams or team members via integrations with communication hubs, like Slack or email.
To delve into the Alertmanager, forward port 9093 of the Alertmanager container to the local host:
kubectl port-forward alertmanager-prometheus-operator-158533-alertmanager-0 9093 -n monitoring
Alertmanager is then accessible via the browser at http://localhost:9093, as shown in Figure 5.