
kentoh - Fotolia
Try out the Graphite monitoring tool for time-series data
Combined with third-party tools, Graphite provides a number of benefits for IT performance monitoring. Explore its core components -- including Carbon and Whisper -- and basic guidelines for installation.

The Graphite monitoring tool graphs time-series data from multiple sources in real time, or on demand -- and at massive scale. This tool supports many uses cases in IT system monitoring and the business, and across all kinds of applications.
Graphite's documentation focuses almost exclusively on how to use the tool for performance monitoring. However, the tool suits any kind of time-series data. For example, users could track:
- the number of customers who walk in and out of a retail store, which would indicate when it's time to open an additional cashier lane;
- the operating temperature of a machine, which would indicate when it's necessary to change a filter or perform other maintenance, and;
- flight arrival and departure statistics to track air travel.
Another Graphite use case is to apply analytics to a data feed to highlight only what is statistically significant in Graphite charts. For example, enterprises could feed data from applications or system monitoring tools into Apache Spark, or other big data databases, run anomaly detection and then feed that information into Graphite.
Graphite data is easy to visualize, formatted as <value or metric>:<a count, sum, average, etc.>:<time of event>.
While the installation of Graphite is complex, an IT admin can set it up and run it with Docker to simplify the process. It's not necessary to set up any schema or data retention policies: The tool saves a metric and runs various aggregation functions against it.
The Graphite monitoring tool, which is written in Python, averages data and stores it once per minute, or in any user-defined interval. Users can apply built-in or custom functions to the data, and can create scatter, line and histogram charts. It's possible to graph multiple metrics on one time-series chart and stack multiple charts on one canvas, also called a dashboard. None of these functions require programming.
Series in Graphite
In the Graphite monitoring tool, series is the naming hierarchy, similar to folders in other tools. A series can have any name, with a period (.) that separates every further division of the metric the user will plot. To get started, set a value with the series.
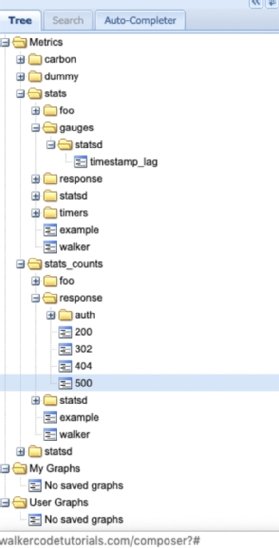
Some series are set up upon installation, based on the options a user selects and the third-party tools they install. Figure 1, which glimpses at part of the Graphite main screen, shows examples of series.
Use periods to group series into hierarchies. There are no rules to hierarchies, so use what makes sense for your IT team or organization. This feature enables enterprises to use wildcards to gather metrics on multiple series at the same time, like stats_count. Examples include:
- graphiteStats.calculationtime
- response.auth.200
- response.auth.302
- delays.united
- position.flight304
- sales.socks
- sales.shoes
The metrics that the statsd daemon gathers will start with statsd. Statsd, which we cover in greater detail below, listens to, and then writes, metric data to Graphite or other back ends.
If using statsd, issue this command to add data to a series:
statsd.incr('some.event')
Graphite architecture
The Graphite monitoring tool is composed of three main components -- in addition to statsd -- which users usually install with Graphite.
- Graphite-web: A web interface powered by Nginx, Apache or another web server with a graphics plugin.
- Carbon: The storage component.
- Whisper: A time-series database.
Graphite-web
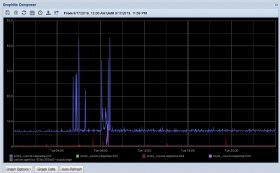
Figure 2 shows a sample graph on the Graphite-web page that plots time and value points. Time is along the bottom x-axis, while the values -- which are the metrics, in this case -- are along the y-axis.
The plotted metrics are indicated by color. The legend is at the bottom. Users can adjust design elements of their dashboards, such as font size and color scheme.
Figure 2 is a line chart: The graphic draws a line from one point to the next one. Graphite documentation includes an example of a stacked chart, wherein the values do not overlap.
Tools and APIs that boost Graphite
In addition to Graphite-web, Carbon, Whisper and statsd, Graphite is the sum of additional third-party tools, data sources and APIs. Some of these include:
Logster. This tool reads logs and -- unlike other tools listed below -- aggregates data. Enterprises can graph data and enrich their Graphite metrics.
Collectd. A daemon created by Orbitz that collects system stats, reads logs and data from external devices, such as network devices, and forwards it to various backends, including Graphite. Written in C, collectd runs on barebones systems that don't require the installation of Python or other packages.
Memcached. This is a system that abstracts memory and CPU across a cluster, which helps scale Graphite.
Scales. A Python API that gathers stats and sends them to Graphite.
Carbon
Carbon, another core component of the Graphite monitoring tool, receives metrics over a network, and then writes them to a disk using Whisper, the time-series database. It stores each series in its own .wsp data file. It can support plaintext, Pickle -- Python objects -- and Advanced Message Queueing Protocol.
During configuration, list the metrics to aggregate and calculate. Use the aggregation-rules.conf file to define a window of time -- 5 minutes, for example -- as well as aggregation methods, such as sum, avg, min, max or p75. Here, p75 indicates the 75th percentile. These methods are helpful to set thresholds during performance monitoring.
Use statsd with Graphite
Statsd is a Python API and a NodeJS daemon. It gathers and aggregates data and sends it to Graphite every 30 seconds.
Statsd users request a metric in Graphite via a uniform format, <metricname>:<value>|<time>. For example, a response of web.server.error.500:1:17:00 means that error 500 was received at 17:00.
The Python code below shows how simple it is to use. Here, we establish a connection to a server and then increment the series some.event by one.
import statsd
c = statsd.StatsClient('localhost', 8125, prefix='foo')
c.incr('some.event')
The statsd data types provide a better understanding of what Graphite does. Data types include:
- Counters: Simple ordinal numbers.
- Timers: Show the length of time something took to complete. This data type is suited for performance monitoring.
- Gauges: Constants for use in functions.
- Sets: A dataset that does not allow duplicate values.
Graphite data sources
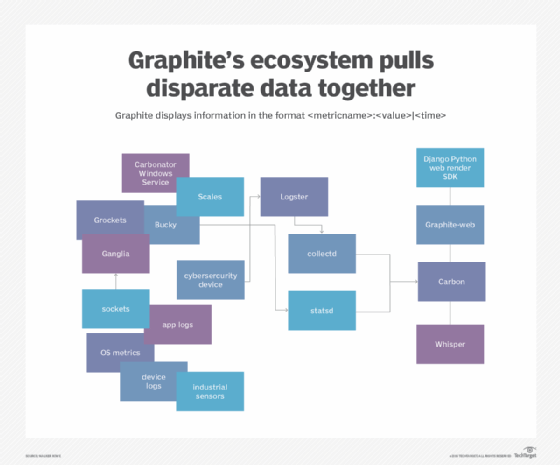
Figure 3 shows the main sources of data for Graphite: logs, sensor output and network connections. Various open source tools can grab data from those sources, parse it and then send it to statsd or collectd, another data-collection daemon. Both of those push the data to Carbon.
The example in Figure 3 depicts how a user can issue the nc command to push data to Carbon, which listens on port 8125. Here, Graphite uses Django, which is a Python framework that displays webpages.
Use Docker for installation
Installation, according to Graphite documentation, is quite "complex." For example, two installation techniques require the user to run Graphite in a VM. However, a user cannot run a VM on top of another VM in a cloud server, because virtualization runs at the hardware layer, not the software layer -- so installation, in these cases, must occur on local machines.
Instead, it is simpler to install the Graphite monitoring tool with Docker.
First, stop any web server or process running on port 80. Then, run the command below to spin up a Docker container.
docker run -d\
 --name graphite\
 --restart=always\
 -p 80:80\
 -p 2003-2004:2003-2004\
 -p 2023-2024:2023-2024\
 -p 8125:8125/udp\
 -p 8126:8126\
 graphiteapp/graphite-statsd
Next, open the browser at localhost:80 to see the Graphite interface.
This server is exposed to a public IP address. The default password is root/root, but consider changing it to ensure hackers do not access the server.