
ktsdesign - stock.adobe.com
Gain deeper IT insight with machine learning for log analysis
As the log analysis tool market evolves, machine learning plays an increasing role in helping IT teams discover significant anomalies and outliers in their data.

Log analysis -- and, intrinsically, a log analytics tool -- is vital to IT monitoring success. The log stream holds the data that leads to incident resolution, and offers insight into traffic behavior and patterns and resource availability versus demand.
But what features should an IT organization seek out in a log analysis tool? First, it's helpful to understand how these tools have evolved in recent years -- and how machine learning for log analysis plays a significant role in that transformation.
Traditional vs. modern log analysis features
The features of a traditional log analysis tool include:
- visualization, including real-time and interactive charts, graphs, histograms and heat maps;
- time-series data analysis charts and point-in-time charts -- these plot one metric over time or plot a sum, count or percentile;
- an API interface that enables programmers to write code to pass data to it;
- the ability to parse any type of log with built-in or custom code;
- distributed fail-safe architecture;
- a query language that enables simple queries, complex joins and nested queries; and
- the ability to integrate third-party plugins, as well as other big data and queueing systems, such as Kafka and Spark, and other log analysis tools or systems.
A modern log analysis tool, by comparison, often includes the features listed above in addition to machine learning capabilities that can point out actionable items, offer more meaningful alerts and provide charts that clarify information contained in raw log files. These features include:
- ability to flag anomalies;
- regression analysis and correlation;
- ability to make predictions;
- handle seasonal and daily variations to reduce false positives;
- data preprocessing to fit into machine learning models; and
- ability to attach to cloud-based machine learning APIs.
The traditional approach and its shortcomings
Machine learning models have already made their way into some IT organizations, but the eyes-on approach to log analysis still reigns in too many cases.
For example, an IT operations admin pulls together logs via Logstash -- a log parser -- from hundreds of disparate sources. The admin stores them in ElasticSearch, a JSON database, and then displays desired metrics in dashboards in Kibana.
But these charts present only raw data: web hits per minute, CPU usage and memory usage, for example. This data is taken in isolation, each entry from a specific point in time. This overlooks any correlation.
Consequently, these graphs won't display trends, nor will they define normal levels of volatility. For this system to work, an analyst would need to possess a lot of knowledge and be fully attentive to correlate multiple data points concurrently. It suffices to say that this approach does not work.
Use cases for machine learning in log analysis
Machine learning uses algorithms, linear algebra and calculus to train models to discover significant information in logs. This reduces the noise that makes traditional log analysis unreliable or unhelpful.
Here are some use cases that illustrate how machine learning for log analysis makes it easier for IT admins to extract meaningful data:
Analyze router logs
An example router log from Verizon looks as follows:
1331901000.030000	C56nlH3SloWOj44ABi	192.168.202.79	46123
	192.168.229.254	443	tcp	ssl0.010000	548	1060	SF	-
	0	ShADadfFr	8	972	13	1744	(empty)

1331901000.020000	CNTrjn42F3LB58MZH6	192.168.202.79	50469
	192.168.229.251	80	tcp	htt0.020000	166	214	SF	-
	0	ShADfFa	4	382	3	382	(empty)
It's impossible to know, at a glance, if the router is being hacked, if an industrial sensor needs a replacement or if this is status quo -- but a log analysis tool that uses machine learning can provide these insights, as it processes high volumes of data in multiple dimensions.
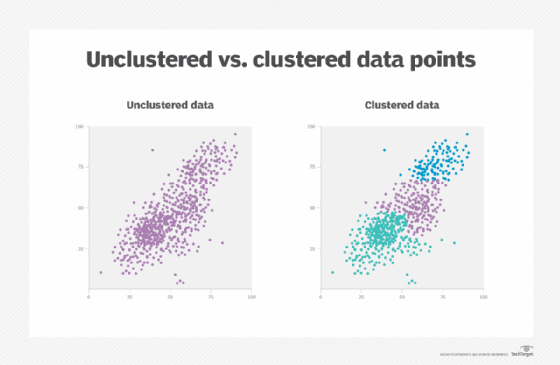
The machine learning model that analyzes a router log to find outliers would use a clustering function that groups data points. The model discovers the distance between data points and assigns them to the nearest cluster of other data points.
The example graphic below shows data in its raw format on the left, and then after a clustering algorithm has been applied. Outliers -- the points furthest away from the clusters -- are router events that analysts must investigate.
Anomaly detection
ElasticSearch and Loggly are two tools that perform anomaly detection for log analysis.
The bell curve represents a traditional approach, in which an alert is sounded when a specific threshold is met. But this model relies on empirical observation and experience; these are valuable assets but yield too many false positives. The bell curve model has a tendency to miss significant events and sound the alarm for events that aren't.
Anomaly detection accommodates for cyclical events, such as the hours in a business day or ecommerce activity that surges on Black Friday. It evaluates current events in light of what is considered normal operation.
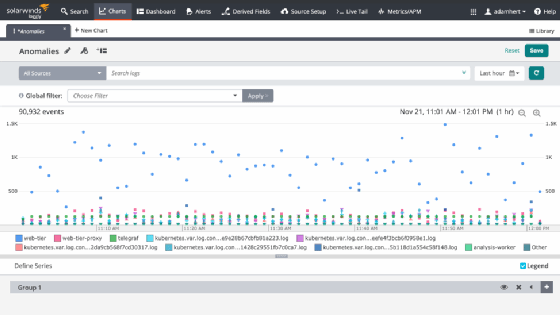
Below is an example of how one monitoring tool, Loggly, does that. It flags events as related to a previous time span, rather than as single points in time. It illustrates whether certain errors are increasing relative to what has been normal operation.
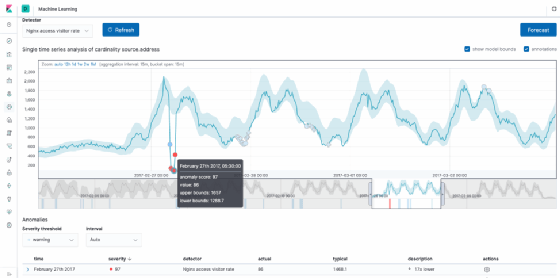
Below is an example of ElasticSearch's anomaly detection. The UI enables admins to select specific metrics, and the graph will display flagged anomalies in red. This algorithm is smart enough to know that data is cyclical. So it follows the curve, thus solving some of the limitations of the standard deviation approach.
Regression analysis
Correlation across disparate data sources is an important aspect of machine learning for log analysis.
To make correlation work, teams must write code or make queries to join datasets. Admins must both join different datasets by some common element and build a regression model -- which isn't simple. Machine learning enables this, but still requires admins to collect different sources of data. There is no black box that will automatically do all of that for them.
ElasticSearch did, however, take steps to simplify this process with its acquisition of Prelert in 2016, which improves real-time correlation across multiple data sources.
Whether to build, buy or rent
Log analysis systems are designed to gather raw log data, but that data must be converted into a specific format in order to be plugged into most machine learning models. This means that computer code and programmers must act as an intermediary between the log source and the visual display. This setup requires time and money.
There are so many moving parts in a log analysis system that the question of hosting is no small matter. Should an organization use its own servers? Does it host everything with a cloud vendor? Does it write its own machine learning models, or use those that are in the cloud?
ElasticSearch and Grafana offer cloud options, which means the vendor manages the underlying infrastructure -- but users must still parse data and set up Logstash, for example, on their own servers. The cloud vendor provides only the dashboard and database; it doesn't give users access to a command line where they can use their own Python machine learning code.
If your IT team doesn't have programmers with skills in machine learning for log analysis, there are cloud products, such as Amazon SageMaker, but they don't let users tweak code and they can be difficult to plug into a busy pipeline. SageMaker, for example, requires admins to push code to S3 storage.