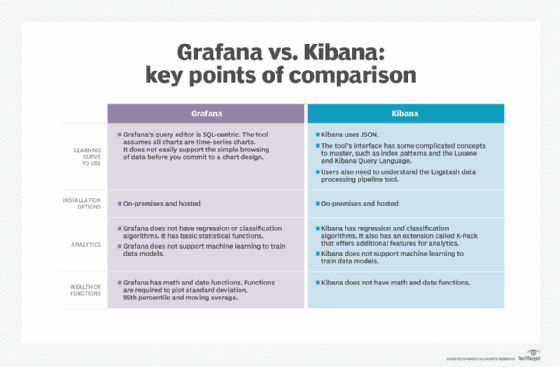
Evaluate Grafana vs. Kibana for IT data visualization
Take a deep dive into how Grafana and Kibana can help IT admins visualize critical system data through this database monitoring example.

Data visualization and charting tools enable IT admins to more easily identify important trends in application and infrastructure performance. These tools can play a critical role in an overall IT monitoring strategy.
Grafana and Kibana are two data visualization and charting tools that IT teams should consider. This in-depth comparison of Grafana vs. Kibana focuses on database monitoring as an example use case. The goal of such monitoring is to ensure that the database is tuned and runs well despite problems such as corrupt indexes.
We'll also consider the available data sources for each tool, implementation and setup processes, and the preprogrammed charts and data parsers available that can reduce the burden and complexity to create these components from scratch. Neither product, however, makes logical charts with just a few clicks, as tools such as Tableau or Microsoft Excel do, nor do they offer a widget that allows you to click through different chart styles to instantly switch from, say, a histogram to a pie chart.
Grafana overview
Grafana vacuums up data from other monitoring systems and databases. It's an open source tool, which means any user can check out the Grafana source code, make changes to it and submit the changes to Grafana for approval.
You can run the tool on the Grafana cloud platform or install it locally. Except for the Elasticsearch example, the scenarios examined here were run locally.
Grafana dashboards are created based on input from a crowd of contributors. These dashboards vary in sophistication and ease of use, but they are useful for the simple reason that it is often easier to build off of someone else's creation than to create your own.
Below are some sample dashboards from Grafana. Here, the data comes from the monitoring tool Prometheus.
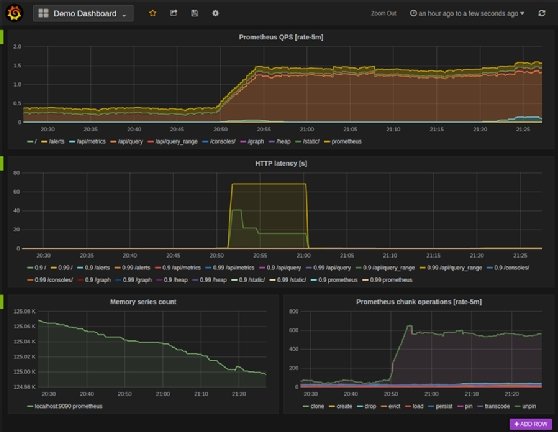
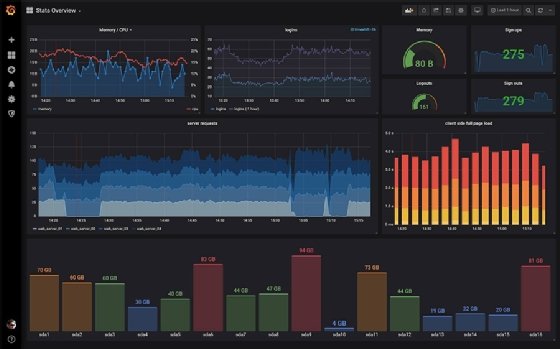
And here is an example of an alerting dashboard.
Supported data sources
Grafana can pull data from databases and IT monitoring tools, including:
- AWS CloudWatch
- Azure Monitor
- Elasticsearch
- Google Cloud operations suite (formerly Stackdriver)
- Graphite
- InfluxDB
- Loki
- Microsoft SQL Server
- MySQL
- OpenTSDB
- PostgreSQL
- Prometheus
An example of Grafana data plotting
Let's look at how Grafana plots performance data from one of these data sources -- PostgreSQL, a database server.
The goal with monitoring PostgreSQL or any database is to identify locked queries, slow queries, replication and index issues, full table scans, memory surges, improperly sized caches and other problems. You monitor PostgreSQL by both looking at the metrics the product produces as well as the OS resources consumed by the database such as CPU and memory.
First, change the configuration of PostgreSQL so that it will generate performance statistics. Use this command to open the configuration file:
sudo vim /etc/postgresql/9.5/main/postgresql.conf
Then, paste in these lines:
#------------------------------------------------------------------------------
# RUNTIME STATISTICS
#------------------------------------------------------------------------------

# - Query/Index Statistics Collector -

track_activities = on
track_counts = on
shared_preload_libraries = 'pg_stat_statements'
track_activity_query_size = 2048


pg_stat_statements.track = all
Then, as the postgres user, open the psql shell and run this SQL statement:
CREATE EXTENSION pg_stat_statements;
Create a data source
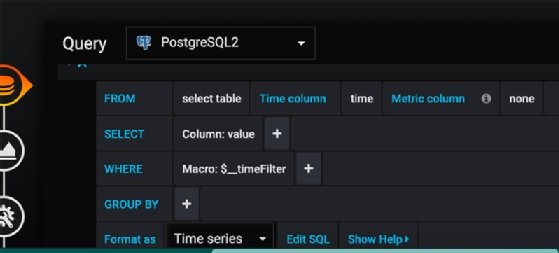
As with any charting system, the first step toward visualizing data in Grafana is to connect to a data source, as shown below. We need to create a query, then create the chart.
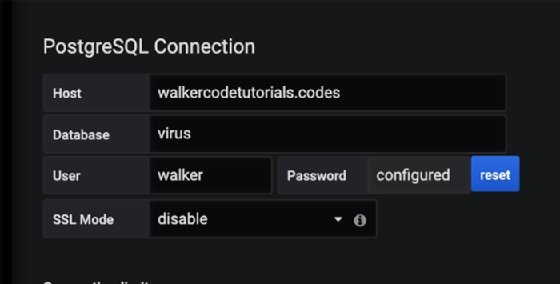
Grafana does not automatically recognize whether a data source is network traffic, operating system metrics, database metrics or some other type, and then populate a query accordingly. Instead it presents you with an interface and asks you to pick columns.
Below is a SQL query builder in which you pick a table and columns. There must be a column in the table named Time. If you don't have that column, you'll have to add one with a query or function. (This differs from Kibana, which automatically adds a @timestamp to every entry that it gathers.) Create a formula or use the Edit SQL button shown in the image below to write one.
Grafana has a wealth of math, date and statistical functions, which are used to perform computation to create charts. For example, you may want to plot a moving average in a time-series chart instead of a single point-in-time metric. This reduces outliers that can obscure whether a metric trends up or down. Those functions also help you plot statistics that are important to track metrics, including quartiles and variance.
Add a PostgreSQL SQL query
With PostgreSQL, I wrote this SQL query to add a Time column:
PRE select stats_reset as time, tup_fetched , tup_returned tup_inserted , tup_updated, tup_deleted from pg_stat_database where stats_reset is not null;
The table dropdown does not show the pg_stat_database table, which is where PostgreSQL gathers some of its performance data. You must use the SQL Editor. When you do this, Grafana shows a small chart that displays the metrics it has gathered.
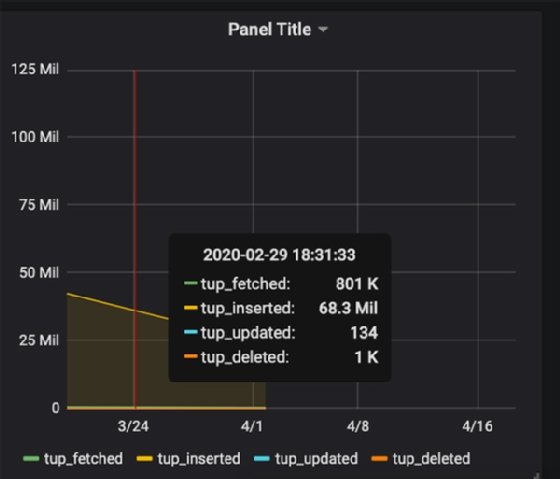
This is not the final chart, however. Now go to the Dashboard screen to create the chart.
Elasticsearch as a Grafana data source
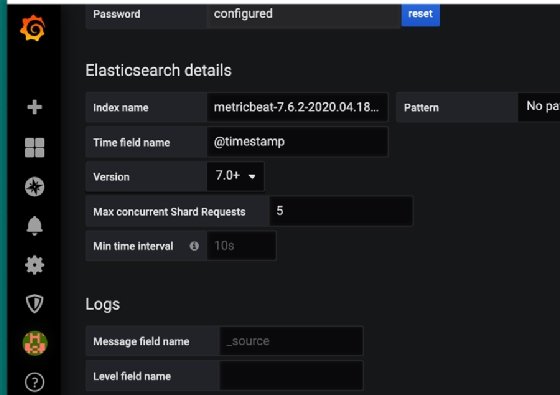
Grafana collects data from a variety of sources. Let's briefly walk through one more example, using Elasticsearch.
Create a data source and select an index from Elasticsearch.
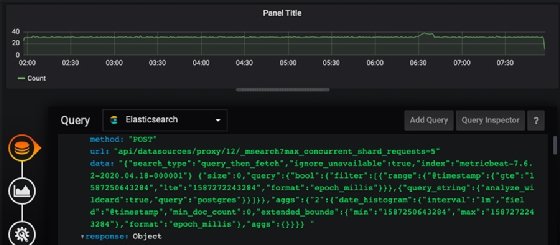
Without creating any chart, you can see this heartbeat-type query against PostgreSQL.
Grafana plugins and pricing
Grafana provides a rich set of chart templates, called plugins, which you install using the Grafana command-line tool:
grafana-cli plugins install grafana-piechart-panel
These are different than the complete dashboards contributed by users. Plugins are chart types, not charts already programmed to fit a certain data source. For the standard cloud version of the tool, prices start at $49 per month, for 10 users, 3,000 series (a series is a chart) and 100 GB of logs. Each additional user costs $5. Additional long term (two years) log retention starts at $16/1000 series/month. Over 100 GB of logs is $0.50/GB/month.
Kibana overview
Kibana is not a product that stands by itself; it is the data visualization tool for Elasticsearch, a database designed to store JSON documents of any type. It is part of the Elastic Stack bundle, with Elasticsearch and the open source Logstash data pipeline.
Elasticsearch is not open source. You can find its source code on GitHub, but it is there only so users can report bugs and request additional features. The following chart shows some of the many data sources for Kibana.

Elasticsearch provides data shipping software called Beats to parse logs from these products or connect to them. These divide the fields using regular expressions so that they can be labelled and loaded into Kibana and Elasticsearch. This saves users from having to write these parsers themselves.
There are various Beats, including Filebeat (applications that output logs), Metricbeat (applications to which Elasticsearch can connect directly) and Packetbeat (network traffic). Metricbeat has a lengthy list of more than 3,000 metrics that it gathers.
Monitoring PostgreSQL with Kibana
To further illustrate the differences between Grafana vs. Kibana, let's revisit the PostgreSQL example.
The fastest way to get started is to sign up for a free 14-day trial, which will deploy to Google Cloud, Amazon or Azure. Next, install Metricbeat on your local server to gather metrics and ship those to Kibana. (You can use a Docker container or run the apt-get install Metricbeat after you have added Elastic to your source code repository.)
After that, open the Metricbeat config file using this command:
sudo vim /etc/metricbeat/metricbeat.yml
Then, enter your cloud credentials into the file.
cloud.id: tech_target:XXXXXXX

# The cloud.auth setting overwrites the 'output.elasticsearch.username' and
# 'output.elasticsearch.password' settings. The format is '<user>:<pass>'.
cloud.auth: elastic:XXX
Next, run this command to create the PostgreSQL configuration file for Metricbeat:
sudo metricbeat modules enable postgresql
Then, run this file to push the PostgreSQL dashboard to Kibana:
sudo metricbeat setup
Now, run the following command to start Metricbeat in the foreground. Look for and fix any errors.
sudo metricbeat -e
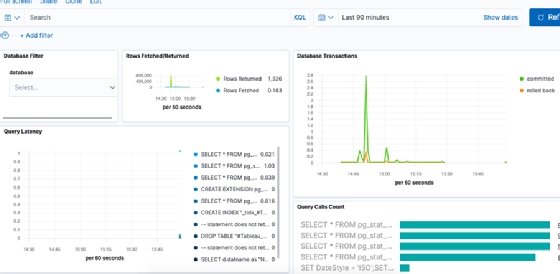
Run some queries in PostgreSQL to create some traffic. Then click on the Dashboard screen in Kibana and search for the PostgreSQL dashboard.
The dashboard screen has multiple sections -- an example section, which depicts database transactions, query latency and other metrics, is below.
Kibana plugins and pricing
There are a variety of third-party plugins for Kibana, many of which are quite specialized in their design. For example, there are data visualization plugins that support 3D graphs and charts.
Pricing for Elastic Cloud, which includes hosted versions of Elasticsearch and Kibana, starts at $16 per month for a single user installation. Prices go up with the size of the servers and storage.