OpenTelemetry aids distributed tracing, Kubernetes monitoring
OpenTelemetry combines multiple CNCF observability projects, as well as multiple enterprise data collection mechanisms, simplifying Kubernetes monitoring.
The OpenTelemetry project defines a standard set of data collectors that support multiple observability tools, which offers significant advantages for Kubernetes monitoring, early adopters said.
OpenTelemetry emerged in May 2019 as a Cloud Native Computing Foundation (CNCF) sandbox project. It combines two previously separate open source distributed tracing projects: OpenTracing, founded as a CNCF project in 2016, and OpenCensus, created by Google in early 2018.
Distributed tracing is an IT observability technique in which applications are instrumented with embedded code that generates fine-grained data about how applications and infrastructure systems process transactions. The practice has become popular along with Kubernetes and microservices, since it's often necessary to track, or trace, transactions through these distributed systems to troubleshoot issues.
OpenTelemetry comprises a set of open source code libraries and software agents that support applications in several languages, including Java, JavaScript, Python, Go and Erlang. Instrumented applications send distributed tracing data to OpenTelemetry collectors that are compatible with multiple analysis and visualization tools, including open source Jaeger, ElasticSearch, Prometheus and Zipkin; cloud provider monitoring systems from Google and Microsoft Azure; and products from Datadog, Honeycomb, Lightstep and New Relic.
Combining the projects has boosted community momentum around a set of standards that can replace multiple libraries and software agents. OpenTelemetry remains an early-stage beta project, but IT pros at KubeCon Europe Virtual this week said they're eager to try it out.
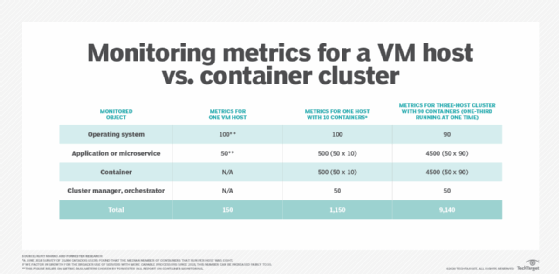
Containers and microservices infrastructures are much more complex than traditional VMs, making fine-grained distributed tracing tools necessary for troubleshooting.
"Let's say I'm using New Relic right now, and I want to move to Dynatrace or something else," said Piyush Baderia, a KubeCon attendee and lead organizer for Kubernetes & Cloud Native Computing Mumbai, who has followed the OpenTelemetry project and experimented with it. "Currently, I'd have to move away from New Relic instrumentation, configure Dynatrace instrumentation, and if it doesn't work out, I have to go back to New Relic, and if there's an issue with that agent, I have to do the entire cycle over again."
All I have to do is plug in different configurations, and I can use vendors as I want.
Piyush BaderiaLead organizer, Kubernetes & Cloud Native Computing Mumbai
OpenTelemetry's unified libraries and agents, however, could eliminate swapping out vendor-specific code to switch tools.
"All I have to do is plug in different configurations, and I can use vendors as I want," Baderia said.
Unified instrumentation also means an IT ops team can use free open source tools for nonproduction environments, which cuts down on commercial licensing fees and enables more sophisticated performance management and troubleshooting in development, Baderia added.
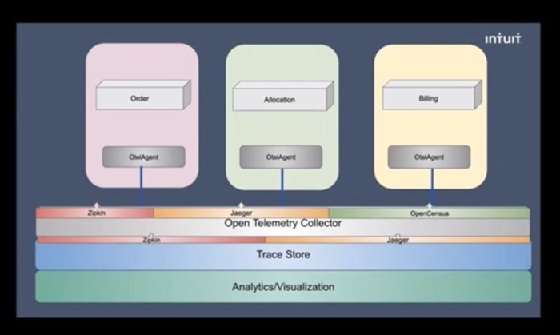
Similarly, standardized Kubernetes monitoring instrumentation means large organizations, such as financial software maker Intuit, can feed data from multiple developer teams' preferred tools through a single collection mechanism that enables centralized data analysis.
"We use both Zipkin and Jaeger libraries to handle instrumentation in our services," said Jonah Back, principal software engineer at Intuit, in a Slack Q&A session following a KubeCon presentation this week. But, since both tools use the same propagation headers and OpenTelemetry supports Zipkin, the data from both can be used together, Back said.
Kubernetes monitoring standards cut down on overhead
Intuit engineers have developed Zipkin plugins that extract metrics from OpenTelemetry data streams and send them to Prometheus time-series databases, a process that's more efficient and faster than feeding metrics to Prometheus through a separate set of data collectors, said Kranti Vikram, staff software engineer at Intuit, in the company's presentation.
Centralized instrumentation also cuts down on Kubernetes monitoring overhead in large infrastructures, such as the one maintained by online retail company Shopify, which spans more than 50 clusters and more than 10,000 services.
Deploying multiple individual data collectors in that kind of infrastructure would be impractical, said Francis Bogsanyi, production engineering lead at Shopify, in a presentation this week.
Shopify, a contributor to OpenTelemetry, is working toward putting the project into production for Kubernetes monitoring in Google Cloud Platform, Bogsanyi said, where it will replace a homegrown tool set the company's engineers created in 2016. It should also cut back on human labor overhead.
"Tracing instrumentation and collection [are] commoditized -- there's no value in doing that yourself," Bogsanyi said in his presentation. "The real value is at the end of the pipeline in analysis, monitoring and alerting."
Still, for mainstream shops, there are different tradeoffs to consider with OpenTelemetry. Not every company has the in-house expertise to work with early versions of open source tools or rely on community support, for example.
"Previously, to use multiple libraries within a single service … I have to maintain instrumentation for both of them and version compatibility with both of them, but this gets consolidated into a single library supported by multiple vendors," Baderia said. "The only drawback I can see is that the commercial support you'd get from a vendor for their own agents … might not be the case with OpenTelemetry because it's an open source project."