Log analytics tools with machine learning capabilities have helped one biometrics startup keep pace with increasingly complex application monitoring as it embraces continuous deployment and microservices.
BioCatch sought a new log analytics tool in late 2017. At the time, the Tel Aviv, Israel, firm employed a handful of workers and had just refactored a monolithic Windows application into microservices written in Python. The refactored app, which captures biometric data on how end users interact with web and mobile interfaces for fraud detection, required careful monitoring to ensure it still worked properly. Almost immediately after it completed the refactoring, BioCatch found the process had tripled the number of logs it shipped to a self-managed ElasticSearch repository.
"In the beginning, we had almost nothing," said Tamir Amram, operations group lead for BioCatch, of the company's early logging habits. "And, then, we started [having to ship] everything."
The team found it could no longer manage its own Elasticsearch back end as that log data grew. Its IT infrastructure also mushroomed into 10 Kubernetes clusters distributed globally on Microsoft Azure. Each cluster hosts multiple sets of 20 microservices that provide multi-tenant security for each of its customers.
At that point, BioCatch had a bigger problem. It had to not only collect, but also analyze all its log data to determine the root cause of application issues. This became too complex to do manually. BioCatch turned to log analytics vendor Coralogix as a potential answer to the problem.
Log analytics tools flourish under microservices
Coralogix, founded in 2015, initially built its log management system on top of a hosted Elasticsearch service but couldn't generate enough interest from customers.
"It did not go well," Coralogix CEO Ariel Assaraf recalled of those early years for the business. "It was early in log analytics' and log management's appeal to the mainstream, and customers already had 'good enough' solutions."
While the company still hosts Elasticsearch for its customers, based on the Amazon Open Distro for Elasticsearch, it refocused on log analytics, developed machine learning algorithms and monitoring dashboards, and relaunched in 2017.
That year coincided with the emergence of containers and microservices in enterprise IT shops as they sought to refactor monolithic applications with new design patterns. The timing proved fortuitous; since the Coralogix's relaunch in 2017, it has gained more than 1,200 paying customers, according to Assaraf, at an average deal size of $50,000 a year.
Coralogix isn't alone among DevOps monitoring vendors reaping the spoils of demand for microservices monitoring tools -- not just in log analytics, but AI- and machine learning-driven infrastructure management, or AIOps, as well. These include application performance management (APM) vendors, such as New Relic, Datadog, AppDynamics and Dynatrace, along with Coralogix log analytics competitors Elastic Inc. and Splunk.
We were able to delegate log management to the support team, so the DevOps team wasn't the only one owning and using logs.
Tamir AmramOperations group lead, BioCatch
In fact, analyst firm 451 Research predicted that the market for Kubernetes monitoring tools will dwarf the market for Kubernetes management products by 2022 as IT pros move from the initial phases of deploying microservices into "day two" management problems. Even more recently, log analytics tools have begun to play an increasing role in IT security operations and DevSecOps.
The newly relaunched Coralogix caught the eye of BioCatch in part because of its partnership with the firm's preferred cloud vendor, Microsoft Azure. It was also easy to set up and redirect logs from the firm's existing Elasticsearch instance, and the Coralogix-managed Elasticsearch service eliminated log management overhead for the BioCatch team.
"We were able to delegate log management to the support team, so the DevOps team wasn't the only one owning and using logs," Amram said. "Now, more than half of the company works with Coralogix, and more than 80% of those who work with it use it on a daily basis."
Log analytics correlate app changes to errors
The BioCatch DevOps team adds tags to each application update that direct log data into Coralogix. Then, the software monitors application releases as they're rolled out in a canary model for multiple tiers of customers. BioCatch rolls out its first application updates to what it calls "ring zero," a group of early adopters; next, to "ring one;" and so on, according to each customer group's appetite for risk. All those changes to multiple tiers and groups of microservices result in an average of 1.5 TB of logs shipped per day.
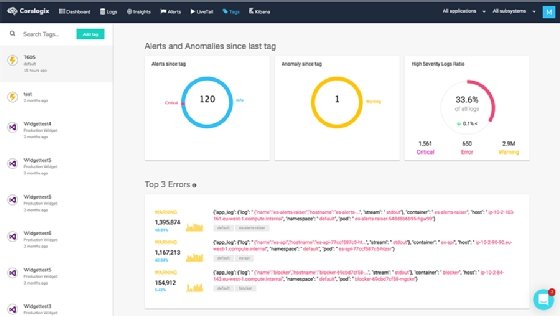
The version tags fed through the CI/CD pipeline to Coralogix enable the tool to identify issues and correlate them with application changes made by BioCatch developers. It also identifies anomalous patterns in infrastructure behavior post-release, which can catch problems that don't appear immediately.
Coralogix log analytics uses version tags to correlate application issues with specific developer changes.
"Every so often, an issue will appear a day later because we usually release at off-peak times," BioCatch's Amram said. "For example, it can say, 'sending items to this queue is 20 times slower than usual,' which shows the developer why the queue is filling up too quickly and saturating the system."
BioCatch uses Coralogix alongside APM tools from Datadog that analyze application telemetry and metrics. Often, alerts in Datadog prompt BioCatch IT ops pros to consult Coralogix log analytics dashboards. Datadog also began offering log analytics in 2018 but didn't include this feature when BioCatch first began talks with Coralogix.
Coralogix also maintains its place at BioCatch because its interfaces are easy to work with for all members of the IT team, Amram said. This has grown to include not only developers and IT ops, but solutions engineers who use the tool to demonstrate to prospective customers how the firm does troubleshooting to maintain its service-level agreements.
"We don't have to search in Kibana [Elasticsearch's visualization layer] and say, 'give me all the errors,'" Amram said. "Coralogix recognizes patterns, and if the pattern breaks, we get an alert and can immediately react."
Dig Deeper on IT systems management and monitoring