Compare Grafana vs. Datadog for IT monitoring
Before committing to either Grafana or Datadog, understand how the two monitoring tools compare in terms of supported data sources, visualization features and more.

There are two types of IT monitoring systems: those close to the original data source and built for one specific purpose, and those, such as Grafana and Datadog, that sit on top of these monitoring systems.
Grafana and Datadog are -- on a basic level -- aggregators that vacuum up data from other data collection tools, such as Splunk, ElasticSearch, Graphite Web and Amazon CloudWatch. Both IT monitoring tools use or include:
- open APIs;
- custom query languages;
- the ability to create variables and scripts;
- analytics;
- the ability to drill into errors and track user interactions; and
- community contributions, including charts.
These features enable data analysts to see detailed information about the cascade of events that led to errors, rather than just a simple error message.
To decide which tool is better for your organization's IT monitoring needs, compare Grafana vs. Datadog in terms of installation process and requirements, supported data sources, and dashboarding and alerting features.
Grafana installation and data sources
The installation process for Grafana is relatively simple. Enter the following Linux command:
sudo apt-get install -y adduser libfontconfig1
wget https://dl.grafana.com/oss/release/grafana_6.5.3_amd64.deb
sudo dpkg -i grafana_6.5.3_amd64.deb

sudo service grafana-server start
Data sources are the applications to which the IT monitoring system connects without user-written code.
Some data sources only require login credentials, while others require configuration on the data source itself to enable connection to a third-party tool. Grafana boasts a long list of supported data sources, which includes Amazon CloudWatch, Azure Monitor, Dynatrace and Elasticsearch.
Grafana divides plugins into those that require a regular license and those that require an enterprise license. Users can divide those plugins into ones that attach to other monitoring systems and ones that attach to the original data sources.
It's easier to connect Grafana to other monitoring systems than to original data sources, which, in both Grafana and Datadog, requires significant configuration work.
Here's a closer look at some Grafana data sources and the effort required to connect to them.
Amazon CloudWatch
CloudWatch requires a manual startup and, once started, provides a bare selection of metrics. To use CloudWatch -- even without Grafana -- users first must configure it inside Amazon.
To connect Grafana to CloudWatch, use the Identity and Access Management (IAM) feature of Amazon security to grant Grafana access just as you would with any other user. Some Amazon users opt out of IAM due to the extra effort required to configure it, which would pose a problem for the Grafana installation.
Grafana packages CloudWatch into the core product -- meaning you don't have to download it from the external plugins page. This is true of several other Grafana data sources, such as Elasticsearch, Google Stackdrive, MySQL and Prometheus.
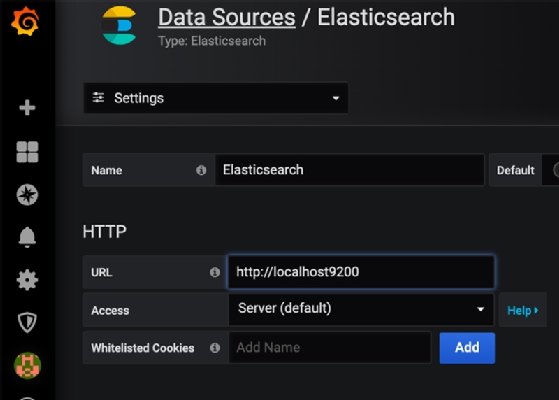
Elasticsearch
As mentioned, Elasticsearch is another native data source. While the Elasticsearch JSON database can contain business data, it is most widely used as a monitoring product. It's really one part of three pieces -- Elasticsearch, Logstash and Kibana -- which together form Elastic Stack, formerly ELK stack. Users often use Kibana as a front end to ElasticSearch, but they can swap it for Grafana instead.
Grafana provides a better way to query ElasticSearch than Kibana. The Kibana query language is rather limited, while the Grafana scripting and query tools allow variables, and thus a full-blown language -- but perhaps not as comprehensive as Datadog's.
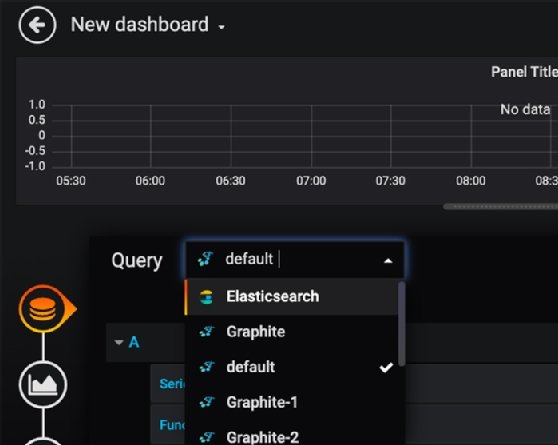
Figure 1 below is the screen where users configure the Elasticsearch connector. Change access type to browser for an easier configuration.
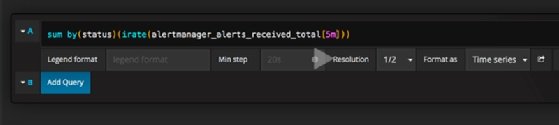
Prometheus
Grafana provides resources and funding to help maintain open source Prometheus and Graphite. Support for Prometheus is prebuilt into Grafana.
As with other connectors, use the Grafana query language to extract the desired metrics, as seen in the example in Figure 2. This language includes functions and the Add Query button enables users to build complex queries.
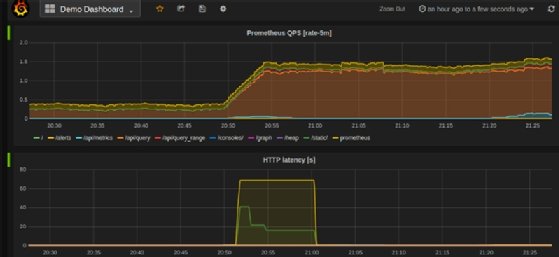
Here is a sample Prometheus dashboard from Grafana's website:
Graphite
Graphite is a popular open source monitoring tool that does one thing -- but does it well: plot time-series data. It's unique in that it uses a simple database, Carbon, which is closer to a clever text file than a full-blown database product.
To try Graphite with Grafana, use Docker to install Graphite Web on any port, for example, port 4444:
sudo docker run -d \
 --name graphite2 \
 --restart=always \
 -p 4444:4444 \
 -p 2003-2004:2003-2004 \
 -p 2023-2024:2023-2024 \
 -p 8125:8125/udp \
 -p 8126:8126 \
 graphiteapp/graphite-statsd
Then configure it in Grafana. In this example, I have installed Graphite on my local machine, so I use localhost for the host:
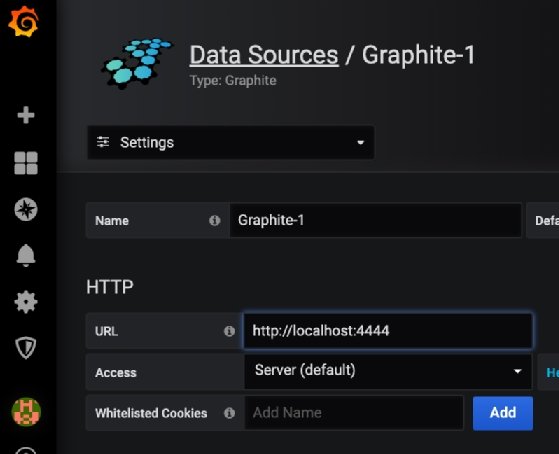
The tool should then respond that the data source is working.
Containers
Grafana supports Docker container installation. As with Docker, in general, the installation is quite simple:
docker run -d -p 3000:3000 grafana/grafana
There is no Docker plugin for Grafana, whereas Datadog does have one. However, both monitoring tools support containers, albeit with some subtle differences.
A monitoring system doesn't actually monitor containers; instead, regular OS metrics describe what resources Docker is using. What organizations monitor, with regards to containers, are the applications that run inside them.
The Grafana approach is to install Grafana plugins inside Docker. Then users can monitor whatever software the container is designed to run -- a database, for example.
To install the Grafana agent inside the container, use the Grafana command line tool:
grafana-cli plugins install ${plugin}
To build Docker images with Grafana plugins already built-in, download the Docker tool from Grafana's GitHub repository.
Grafana dashboard features
A dashboard is a set of charts displayed on a single screen, usually grouped around a common topic, such as networking or mission-critical functions. Data analysts flip between dashboards as they move between items of interest.
Dashboards can also be infrastructure-centric, where they list hosts, containers or microservices. Grafana includes prebuilt dashboards plus others donated from the Grafana user community. Download and import those dashboards as JSON -- then upload them to add them to the installation.
It is not very intuitive to build dashboards in Grafana. Click add panel, then edit, then select drop data source. Figure 5 below shows the resulting screen:
Grafana has several types of charts, such as:
- graph charts, XY line or scatter;
- single stat, which shows the value of a single metric at the present point in time;
- heatmap, which presents quasi-3D information in a two-dimensional chart;
- alert lists; and
- raw logs.
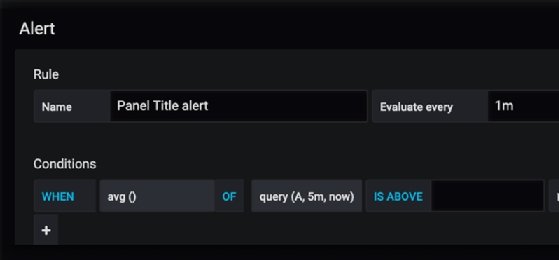
The alert function illustrates where Grafana's query language is useful, as it enables users to write expressions using formulae.
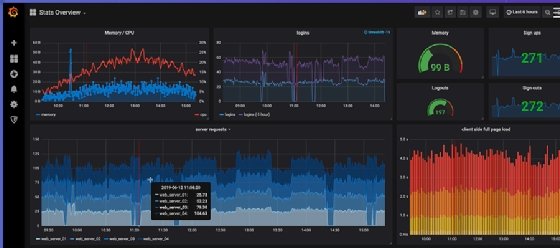
The Grafana dashboard in Figure 7 below includes interactive features that chart creators call annotation. These provide crosshairs and pop-up legends to add more information to a chart that is not possible to do with a less interactive chart.
Finally, Grafana's explore function provides a data walk, or a way to click through metrics that builds up information into a set of queries reproducible for everyday use.
Grafana versions and pricing
Grafana comes in three versions: free and open source; Grafana Cloud, a hosted and managed version that comes in either a standard or pro account; and Grafana Enterprise, which includes additional features and can be hosted or installed on premises.
At the time of publication, a single-user Grafana Cloud license costs $49 per month for the standard account, while pricing for the pro account is done by quote. The enterprise version is meant for companies that need extra plugins and features, and is priced based on active users.
Datadog installation
Users must register in the Datadog cloud -- even if they plan to run Datadog on premises -- to install the Datadog server and agents, as these components install an appkey in the config file that verifies the license and credentials.
As with Grafana, installation is fairly simple. Enter the command:
DD_AGENT_MAJOR_VERSION=7 DD_API_KEY=xxxxxxxxxxxx DD_SITE="datadoghq.eu" bash -c "$(curl -L https://raw.githubusercontent.com/DataDog/datadog-agent/master/cmd/agent/install_script.sh)"
sudo system start datadog-agent
The datadog.yaml configuration file is where users configure the characteristics of the local server, and is the entry point to list all the software on the host they want to monitor -- which is half of the setup. The other half is to put Datadog directives into the targeted software itself:
/opt/datadog-agent/bin/agent/agent run -p /opt/datadog-agent/run/agent.pid
sudo vim /etc/datadog-agent/datadog.yaml
To log in, note that Datadog stores data regionally. Be sure to select the correct domain for login -- organizations in the European Union cannot access the United States servers, for example.
Datadog data sources
Datadog offers more than 350 connectors, or integrations, grouped into 26 categories, including caching, containers, networking, monitoring and security.
Containers
To monitor container metrics, install the Datadog agent on the host, inside the container.
The host base configuration is like Datadog's YAML config file:
sudo vim  /etc/datadog-agent/datadog.yaml


logs_enabled: true
listeners:
  - name: docker
config_providers:
  - name: docker
    polling: true
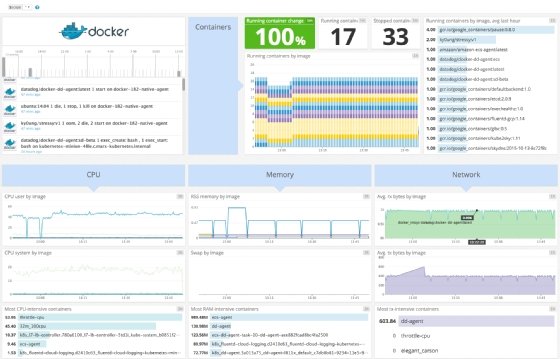
Below, in Figure 8, is a view of the Docker dashboard. At the top, it lists running and stopped containers. At the bottom, it sorts those by CPU and RAM memory usage. To the right, the dashboard shows what each container is running -- for example, a DNS server and Fluentd, which is a log collector.
Prometheus
The idea with the Prometheus connector, as with many connectors, is that users have already installed Prometheus to parse logs and gather metrics. Rather than abandon it to send data to Datadog directly, organizations integrate with their current Prometheus infrastructure.
Prometheus parses logs and then adds user-defined labels to metrics to place them into some logic grouping. Datadog's data-parsing approach with Prometheus is to use OpenMetrics syntax and tools. For example, since Prometheus gathers time-series data, users can pluck out Prometheus data that they want to pass to Datadog, and then label its type.
Quick time-series data refresher
Time-series data includes several metrics, such as:
- gauge, a metric that maintains a value until it changes;
- counter, a metric that tracks increments over time;
- histogram, a metric that looks at frequency distribution; and
- summary, which includes stats such as average, standard deviation and percentile.
The configuration is YAML-based:
init_config:
instances:
- prometheus_url: 'localhost:<PROMETHEUS_PORT>/<PROMETHEUS_ENDPOINT>'
namespace: '<METRICS_NAMESPACE_PREFIX_FOR_DATADOG>'
metrics:
- "<PROMETHEUS_METRIC_TO_FETCH>":
"<DATADOG_NEW_METRIC_NAME>"
Instrumentation libraries
Datadog calls its APIs and software development kits (SDKs) instrumentation libraries. They are in a variety of languages that enable programmers to code to the DogStatsD interface.
DogStatsD is an extension of StatsD, which is a daemon that accumulates and aggregates metrics. StatsD is a standard designed to pass values onto monitoring systems, such as Datadog.
For example, take the Python instrumentation library, called Datadogpy. In this example, metric is a counter, because it uses the increment method.
The Python code gathers the metric. StatsD is the mechanism that passes it on. Datadog provides a means to visualize it, like this histogram:
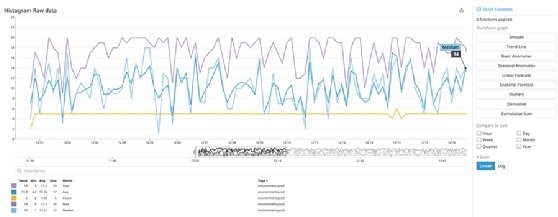
The right of the histogram shows some of the power of Datadog as it includes buttons such as a trend line and even a curve that pushes out seasonality in the metric, which removes noise that can mislead analysts.
Logs
Install a Datadog agent on hosts to forward metrics directly to Datadog. Use the simple tail Unix command, or a tool such as Journald, to gather logs. Both work similar to, for example, Elastic Filebeat.
AWS Lambda
Lambda is a service that enables users to run code on the Amazon platform without worry about the infrastructure details. Think of Lambda as a place to run Python code, for example, without provisioning a VM. Instead, Amazon finds a place on its immense cloud to run it.
MongoDB
Neither Grafana nor Datadog is plug-and-play when users work with original data sources. In the case of, for example, MongoDB, users must do a lot of configuration. They must update the MongoDB config file and add a Datadog user, as well as grant them access to databases and tables.
Examples of a few of the MongoDB metrics that Grafana gathers include mongodb.asserts.msgps, mongodb.backgroundflushing.total_ms and mongodb.connections.available.
Nginx
The Datadog configuration for Nginx is directives that users put into nginx.conf file, as shown below. It parses the lines in the access.log into their corresponding fields.
http {
	#recommended log format
	log_format nginx '\$remote_addr - \$remote_user [\$time_local] '
                  '"\$request" \$status \$body_bytes_sent \$request_time '
                  '"\$http_referer" "\$http_user_agent"';

	access_log /var/log/nginx/access.log;
This captures errors, dropped connections and total traffic, as well as other data. In Datadog, these are labeled like this abbreviated list:
- net.waiting
- net.connections
- net.request_per_s
- cache.hit.bytes
- cache.size
- connections.dropped
Sample dashboards and visualizations
This dashboard in Figure 10 illustrates some of Datadog's chart types and metrics displays.
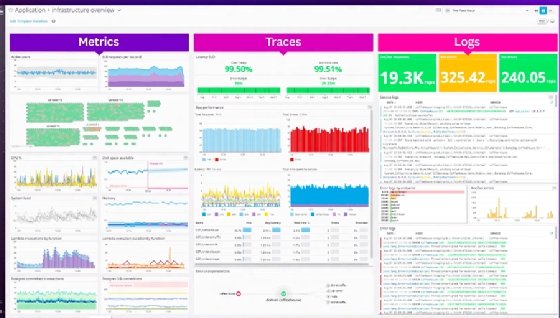
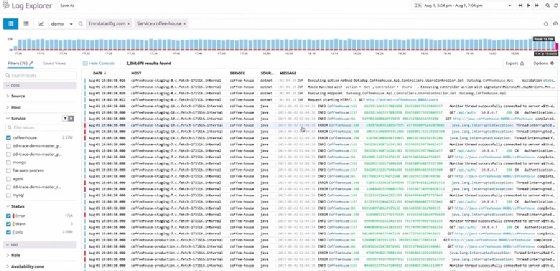
Figure 11 displays the dashboard that shows raw logs. For those familiar with Elasticsearch Kibana, this looks familiar, but with Datadog, users can click on a line to drill into, if the line is a 500-type error. This is called a distributed trace, as it can reach across servers.
Create a dashboard
To create a dashboard, first pick a type. The two options are New Timeboard -- for troubleshooting and correlation -- and New Screenboard -- for status boards and data sharing.
Then select a chart type:
- Heat map
- Check status
- Change
- Host map
- Scatter plot
Notice there is a change chart, which shows whether something is trending up or down.
Datadog auto generates what it thinks users might want, but once it generates, they have a chance to change it.
The tool also adds annotations, so users can click on a single point for additional information. This feature enables the chart maker to add information without overcrowding.
Monitor types
Monitors drive alerts in Datadog.
Notice the machine learning metrics in Figure 12: outlier and forecast. It's not truly a forecast, however, as it's not a trained model. It simply shows when a metric exceeds a threshold.

Datadog machine learning-based alert logic is called Watchdog. Watchdog uses machine learning techniques to flag anomalies, which is an improvement over setting arbitrary thresholds, because it is grounded in mathematical theory.
Users can receive alerts using Pagerduty, Slack and email.
Pricing
Datadog offers both free and paid versions. Users can test a free trial of the paid version, and downgrade to a free edition if they don't want to pay. One of the key paid features is the length of log retention, which is important for businesses that adhere to the General Data Protection Regulation, HIPAA and Sarbanes-Oxley Act standards.
Learning curve for Grafana vs. Datadog
Both Grafana and Datadog have a fairly steep learning curve. One difficulty users will have with both products is they will need a way to distribute the configuration they make on a single machine to many, such as with a DevOps tool like Salt. Otherwise users will spend much time trying to maintain these tools manually.
And even though many of the dashboards are automatic, analysts will need to learn the unique charting concepts, and how to write queries in the query languages, for either product. Both IT monitoring tools offer extensive features, so users must commit substantial time to learn each before making a decision.