Zabbix

Zabbix is an open source monitoring software tool for diverse IT components, including networks, servers, virtual machines (VMs) and cloud services. Zabbix provides monitoring metrics, such as network utilization, CPU load and disk space consumption. The software monitors operations on Linux, Hewlett Packard Unix (HP-UX), Mac OS X, Solaris and other operating systems (OSes); however, Windows monitoring is only possible through agents.
Zabbix can be deployed for agent-based and agentless monitoring. Agents are installed on IT components to check performance and collect data. The agent then reports back to a centralized Zabbix management server. That information is included in reports or presented visually in the Zabbix graphical user interface (GUI). If there are any issues regarding what is being monitored, Zabbix will send a notification or alert to the user. Agentless monitoring accomplishes the same type of monitoring by using existing resources in a system or device to emulate an agent.
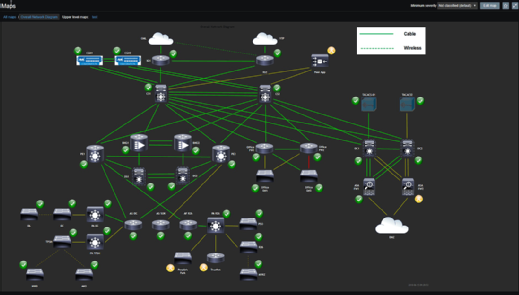
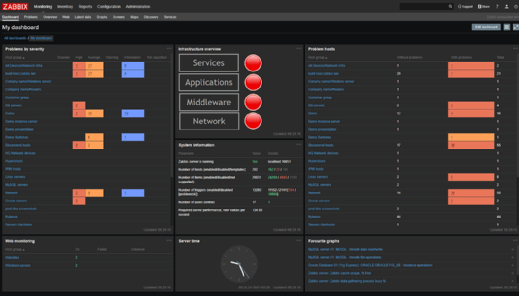
The Zabbix web-based GUI enables users to view their IT environment via customizable dashboards based on widgets, graphs, network maps, slideshows and reports. For example, a user can customize a report to show metrics associated with both service-level agreements (SLAs) and key performance indicators (KPIs) on CPU loads.
Zabbix works via three discovery mode options:
- Network discovery periodically scans an IT environment and records a device's type, IP address, status, uptimes and downtimes.
- Low-level discovery automatically creates items, triggers and graphs based on the discovered device. Low-level discovery can create metrics from Simple Network Management Protocol (SNMP) object identifiers, Windows services, Open Database Connectivity (ODBC) Structured Query Language (SQL) queries, network interfaces and more.
- Auto-discovery automatically starts monitoring any discovered device using a Zabbix agent.
With Zabbix distributed monitoring, remotely run scripts collect data from multiple devices in distributed locations and combine that data in one dashboard or report, such as server availability across the country.
Zabbix can send email notifications based on predefined events in a user's IT environment. Another way for Zabbix users to stay up to date with their IT environment is through mobile applications from suppliers such as M7 Monitoring or of their own creation.
Agentless monitoring options with Zabbix
Zabbix offers several monitoring options beyond agents.
A simple check can verify the availability and responsiveness of a standard service, such as notifications, or HTTP.
Java management extensions (JMX), web monitoring and other methods are also alternatives to using agents. In Zabbix, JMX can be used to monitor Java-based applications. Web monitoring is used to check the availability of websites and supports HTTP and HTTPS. Zabbix collects data relating to the average download speed of a scenario, errors and error messages, response time and more.
The Zabbix API
The Zabbix application programming interface is a web-based API to create new applications, automate tasks and integrate with third-party software, such as go-zabbix, Zabbix::Tiny or Zabbix sender. The JavaScript Object Notation (JSON) format is used to base the API as a front-end web interface.
The Zabbix API consists of many methods that are grouped together into separate APIs, each performing a specific service. For example, a method to create a new host is host.create; the method to log in as an admin is user.login.
Utilizing the API, users can create applications to work with and display Zabbix information.
Templates for additional monitoring capabilities
Templates are custom-built add-ons that extend the functionality of Zabbix. Some templates are made by Zabbix and come packaged with the software ready for use, while others are built by Zabbix users. Templates enable Zabbix users to monitor network devices from vendors such as Cisco, Dell, HP and Juniper. Other templates can be used to monitor IBM, HP and Super Micro servers. Templates for application-based services include Microsoft Exchange and Exchange Server, Zenoss, PowerDNS, Authoritative Server Stats and more. Templates can be created to monitor OSes and hypervisors as well.
Infrastructure monitoring competitors to Zabbix
Microsoft System Center Operations Manager (SCOM), Nagios and Zenoss are examples of competing IT infrastructure monitoring systems.
SCOM enables configuration, management and monitoring for an IT ecosystem through one management console. SCOM can monitor server hardware, system services, OSes, hypervisors and applications, similar to Zabbix. SCOM also uses agent-based and agentless monitoring similar to Zabbix.
Nagios is another open source monitoring program for IT environments. Nagios can monitor Linux, Unix and Windows OSes. Nagios offers multiple products, such as Core, XI, Log Server, Network Analyzer and Fusion. Nagios can run active checks that are self-initiated and run passive checks that are completed using external applications. Nagios uses both agent-based and agentless monitoring as well.
Zenoss is monitoring software available in three forms: Zenoss Core, Zenoss Service Dynamics and Zenoss as a Service (ZaaS). Zenoss Core is the open source version of the software, which contains the basic components of the monitoring software. Core also can be used to create ZenPacks, Zenoss' equivalent to templates. Zenoss Service Dynamics is the on-premises version of the software, which can monitor IT infrastructures, such as servers, networks and databases. ZaaS is delivered as software as a service (SaaS) with the same monitoring capabilities as Service Dynamics.